What’s New in Ona: Release Notes
We’re constantly working to improve Ona, but we’ve overlooked letting the world know what’s been updated. To fix this, we’ve added Release Notes to keep track of updates in each release. We’ll also be sending monthly email summaries to those of you on the mailing list. Here’s the latest summary:
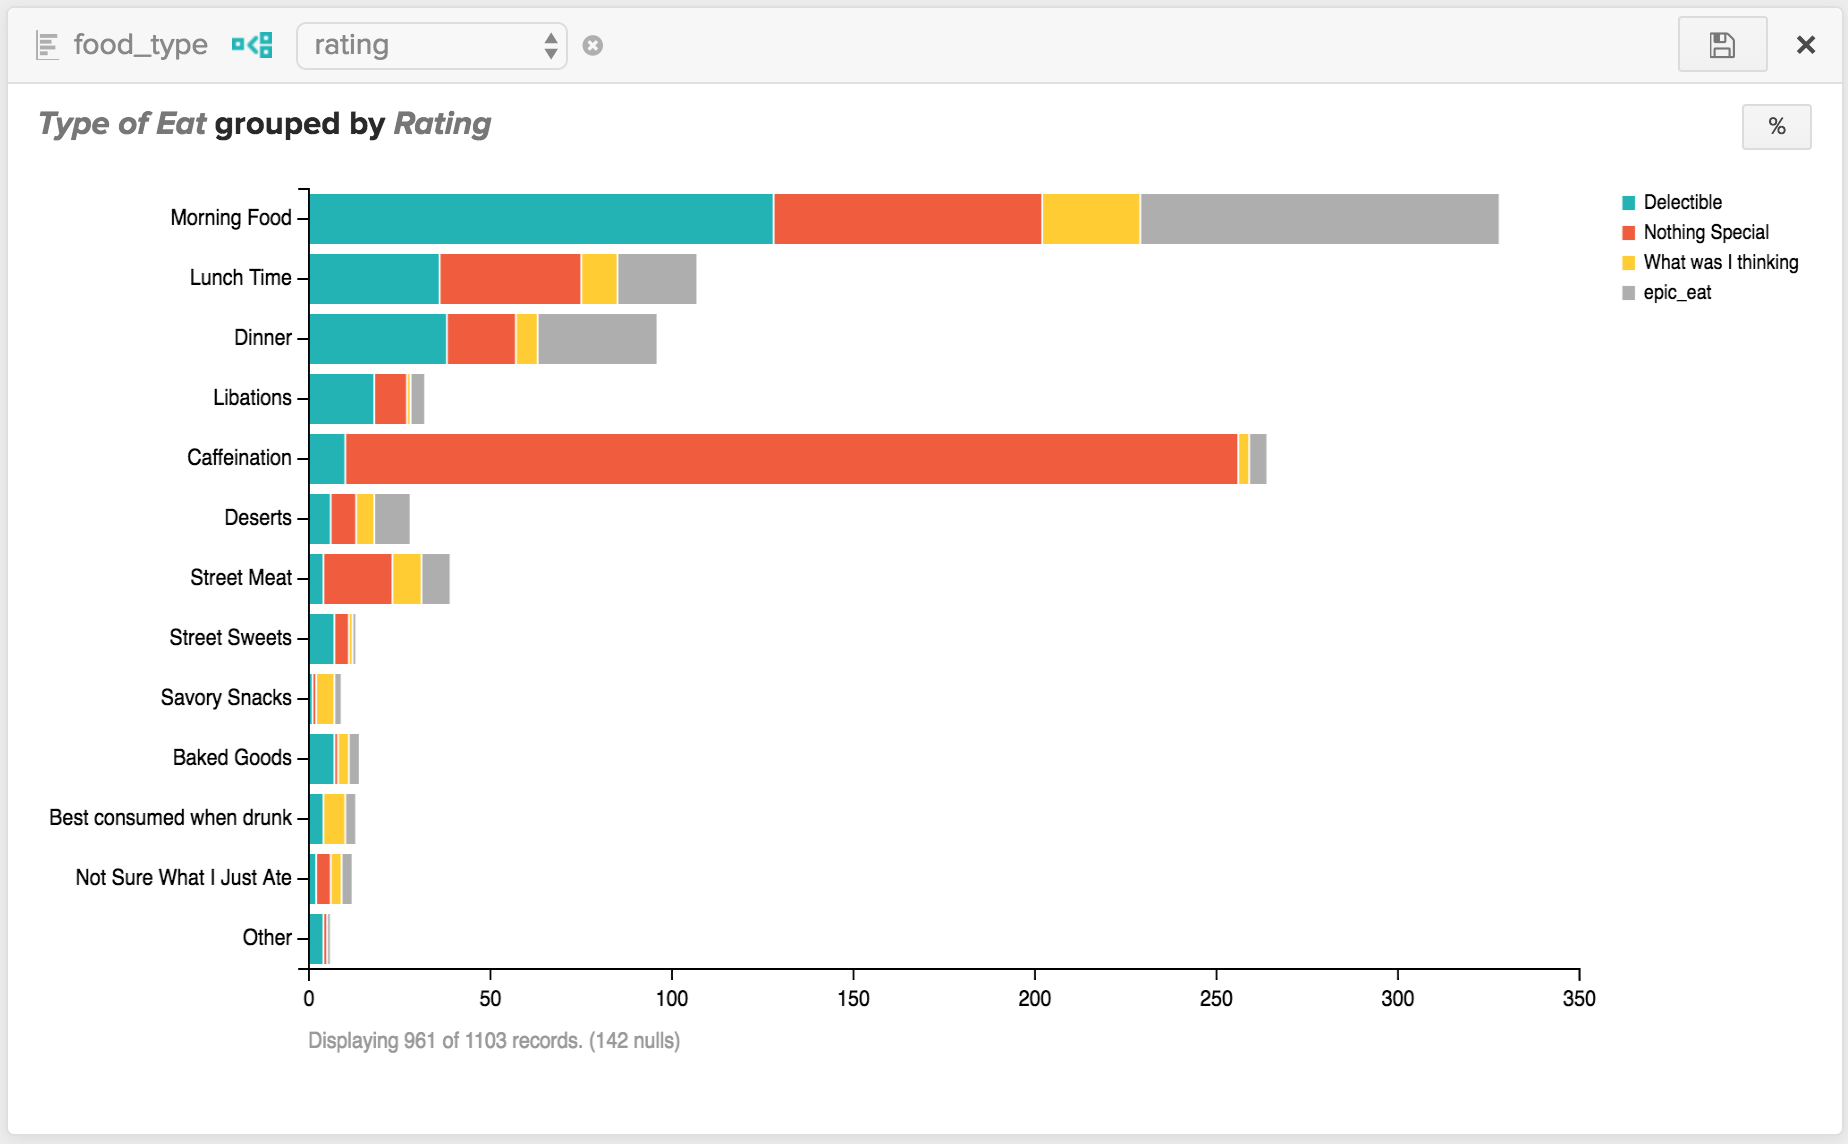
Chart Improvements
We’ve added a few things to charts that make them more useful. For starters, you can now group one field by another. This feature is supported for select one category fields. We’ve also added the ability to define custom colors for pie charts and stacked bar charts. This is an extension of the work from last year that allowed specifying colors for responses on the Ona maps. With our new interactive charts it is now also possible to save charts to a dashboard, allowing you to quickly refer to the charts you are most interested in. In addition to these new features, we’ve made performance improvements that should make the charts interface more snappy.
Exports With HXL
We’ve enabled support for HXL-enabled forms on form downloads and exports. Humanitarian Exchange Language (HXL) is a standard for increasing the efficiency and effectiveness of data exchange during humanitarian crises.
Coming Soon
We’ll soon be supporting exports to Google Sheets, which will allow users to push data to a spreadsheet Google Drive. Users will be able to authenticate and either send data to an existing sheet or a new sheet. A live update option will ensure that the Google sheet is updated every time the Ona form receives new data.